Meijer is the premier retailer of the Midwest, carrying over 220,000 different products at more than 270 supercenters. Offering such a robust collection of items for purchase, Meijer has and continues to make many innovations in the field of supply chain management, one such innovation being Meijer’s automated warehouses.
Through their partnership with the German engineering company Witron, Meijer has revolutionized the storage and management of dry groceries, ensuring operational efficiency. One challenge that Meijer faces is the lack of transparency and visibility that a hyper-efficient system creates. This lack of transparency can lead to difficulties pinpointing inefficiencies and disruptions in the supply chain.
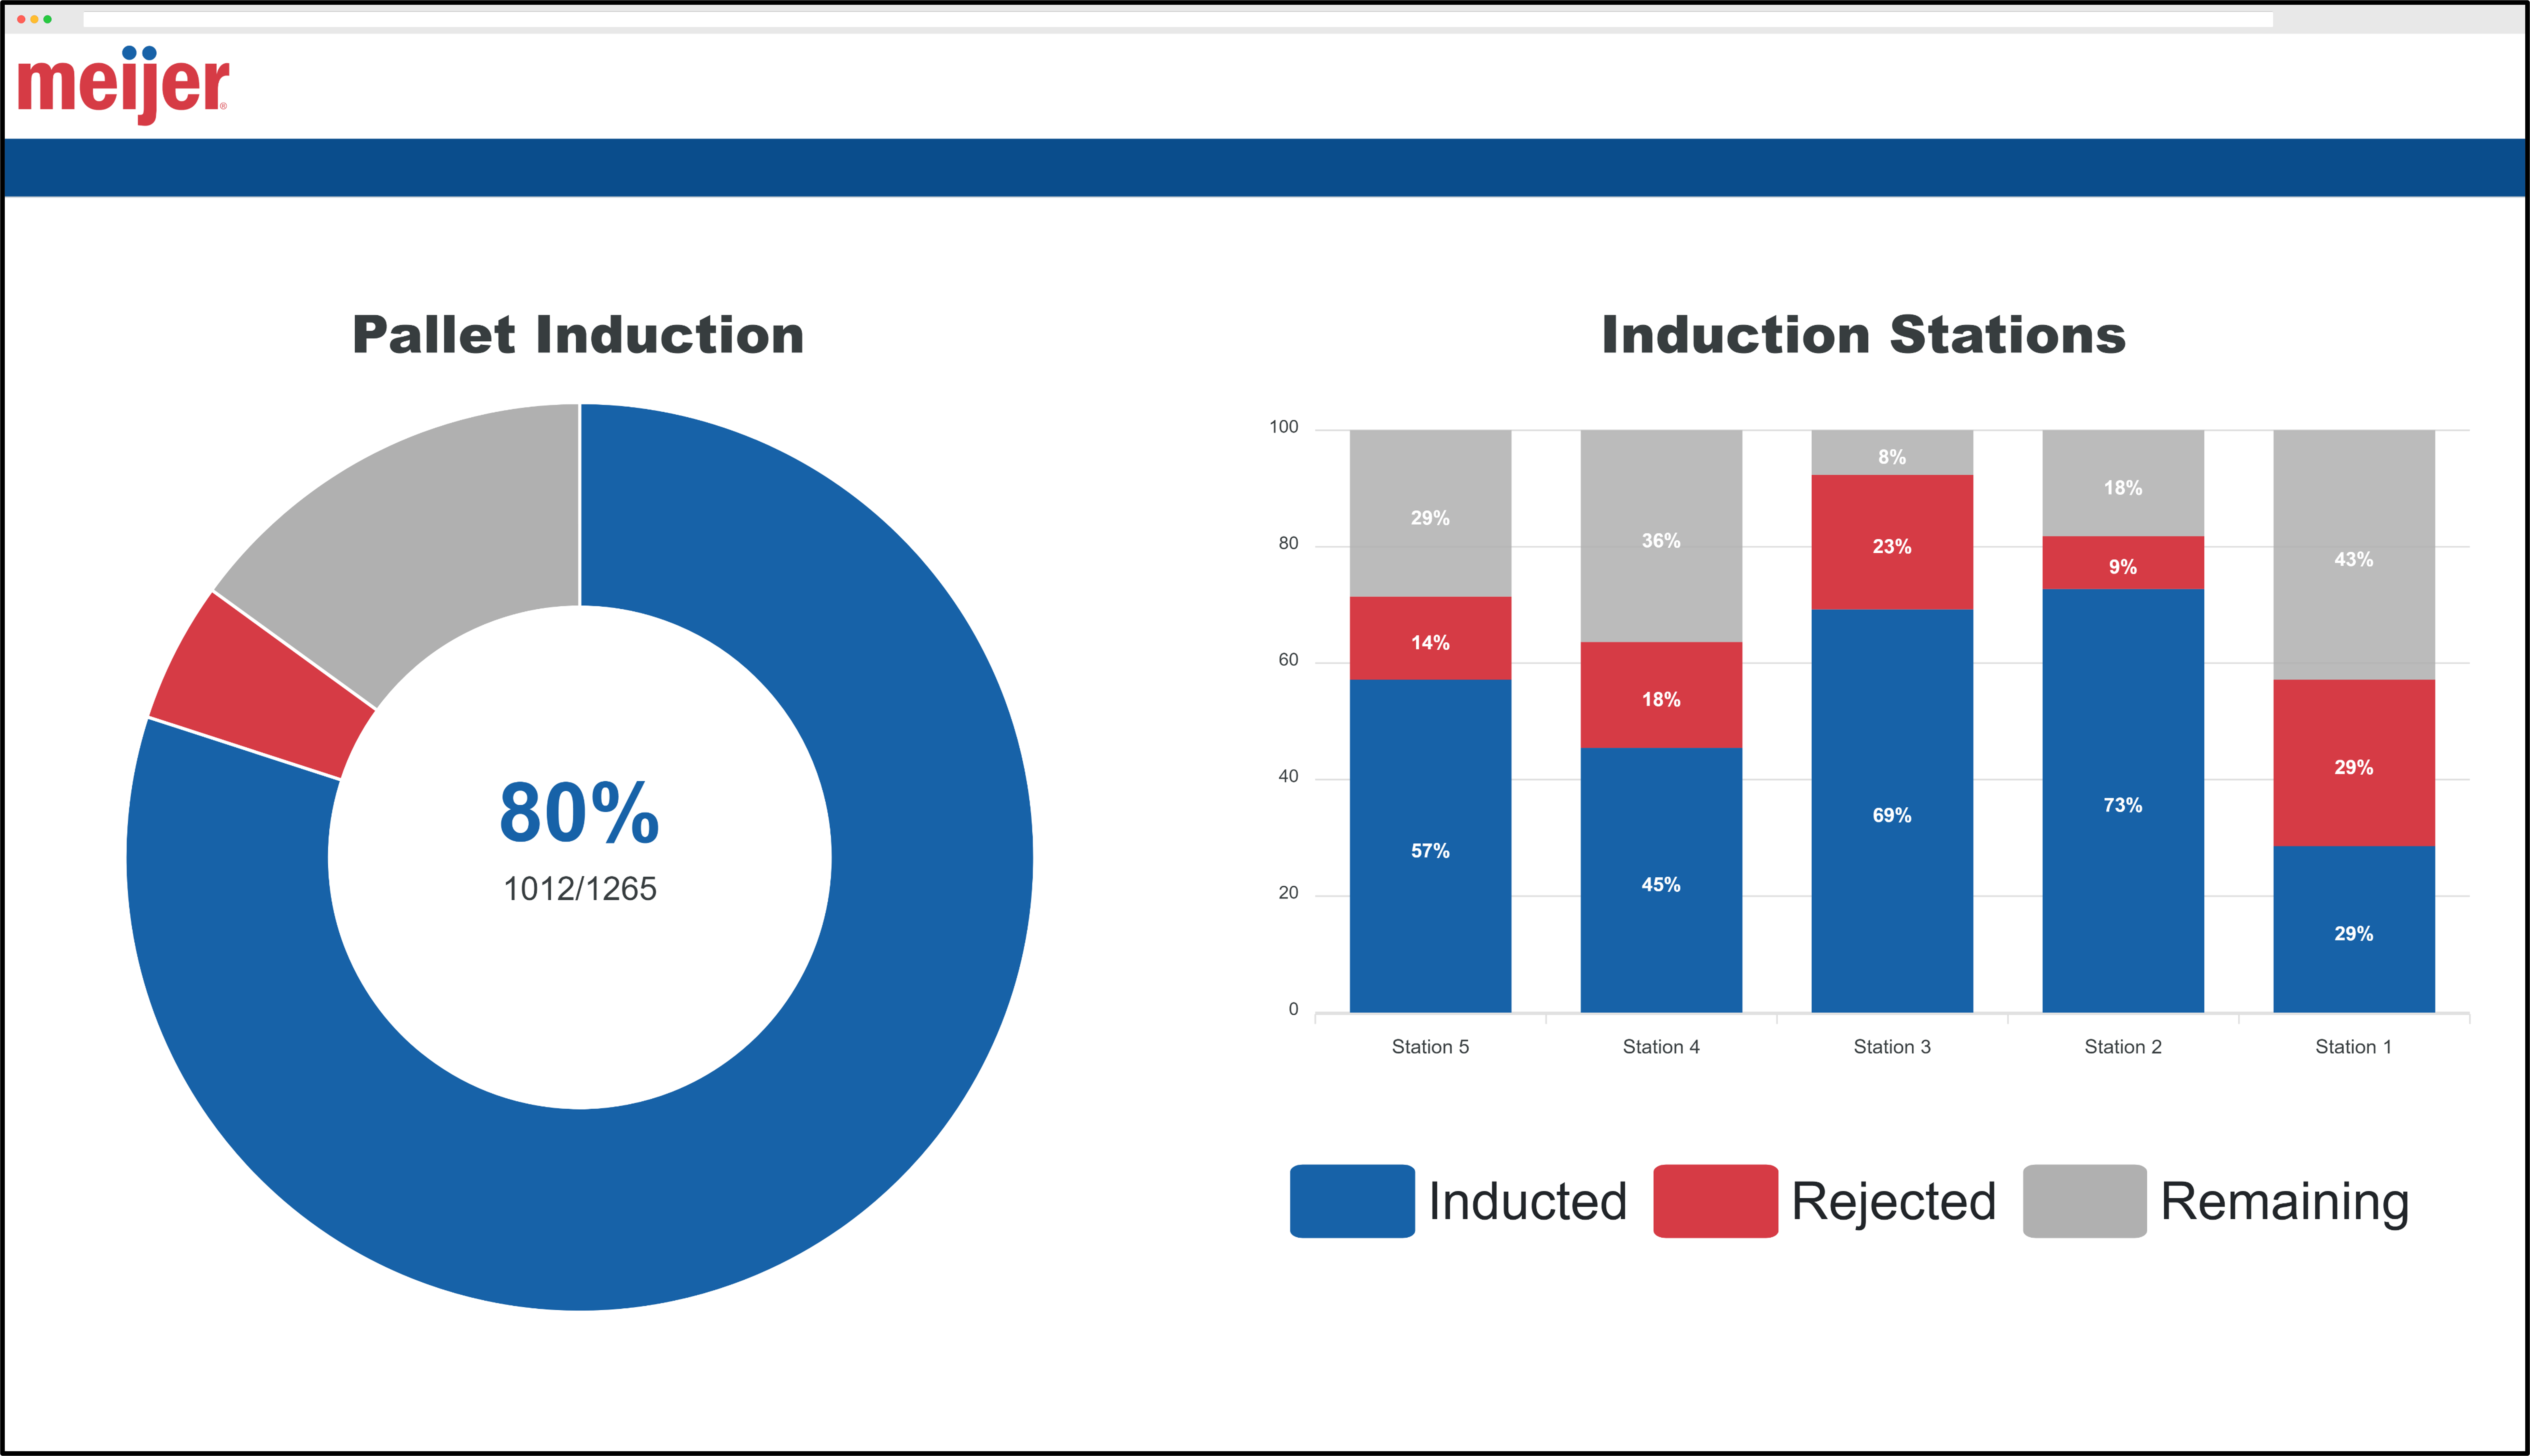
Our Supply Chain Induction Visibility Using Witron dashboard improves transparency by visualizing real-time induction station data and displaying it to employees on the warehouse floor using wall-mounted monitors.

Our dashboard integrates data from both Witron and Meijer, streamlining it onto a singular and concise user interface. The data displayed offers detailed insights into pallet induction, including the number of pallets inducted, rejected, and remaining, ensuring a comprehensive view of each station’s operations.
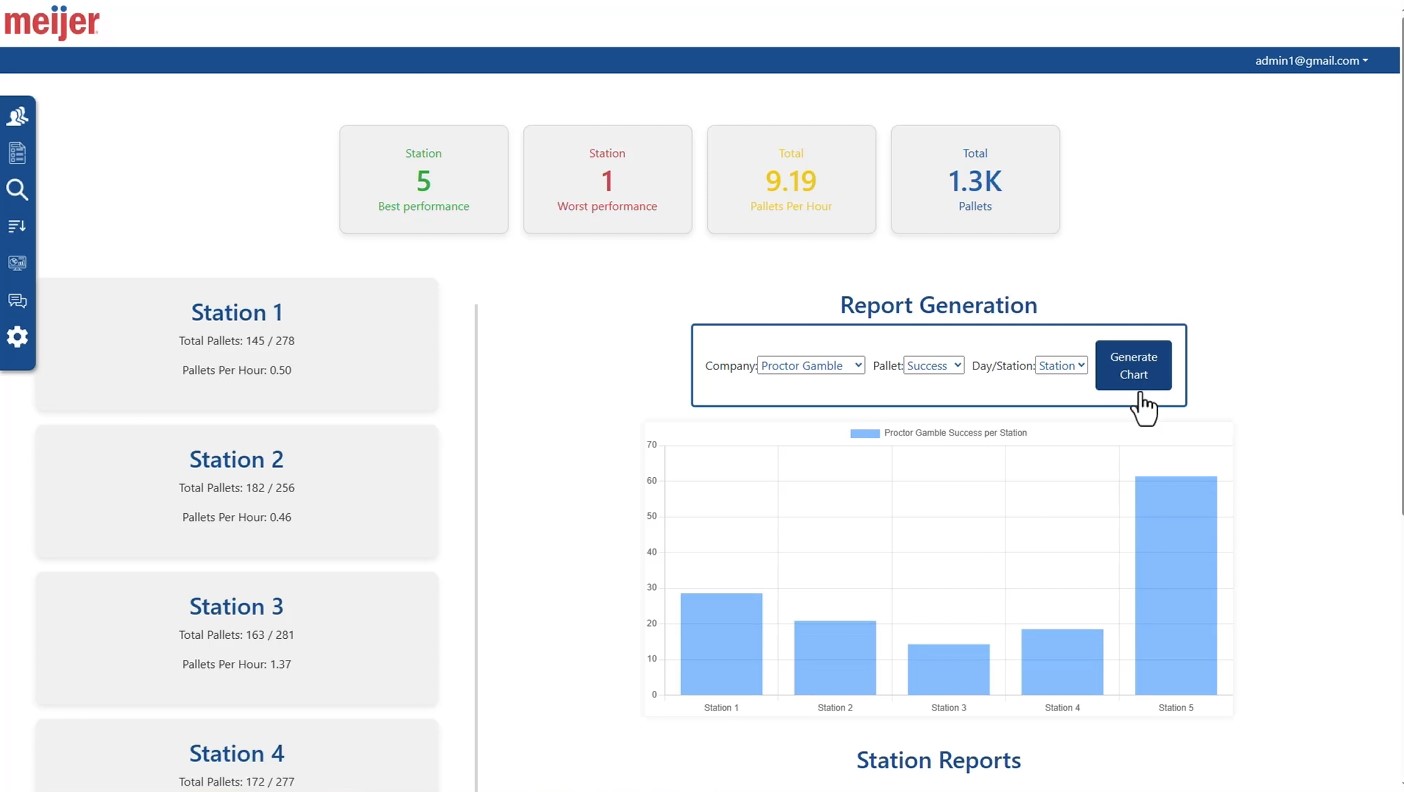
Additionally, the web version of our application enables users with the proper credentials to access an administration page that is configured for both desktop and mobile web browsers. This webpage provides more in-depth statistics for each station and shows efficiency across the entire warehouse, equipping administrators with the information needed to optimize operations.
Our web application is written in C# using .NET Core 8. It is connected to our front end using Microsoft Blazor and is updated on a MySQL database hosted on Microsoft Azure.

This is the reports page I developed, featuring a clean user interface and numerous useful functionalities. It connects to Meijer and Witron APIs to collect and process pallet data, providing comprehensive statistical reports. The page tracks the daily induction of pallets at each station and monitors the speed of induction. Users can generate detailed reports on each supplier based on factors such as quantity, weight, and success rate over time and by station. Additionally, users can view various charts and export these reports to Excel.

Here is our pallet tracker, which connects to our databases to collect and process data, providing detailed information on each pallet in our system. Users can search for any pallet by name or pallet ID and sort by various columns. This tool is invaluable for managers needing to gather information on pallets, including those that may have failed induction and the corresponding timestamps.